[ad_1]
December 21, 2023
4 min read
Here’s how to plan COVID-safer holiday get-togethers, using websites that show viral levels in wastewater

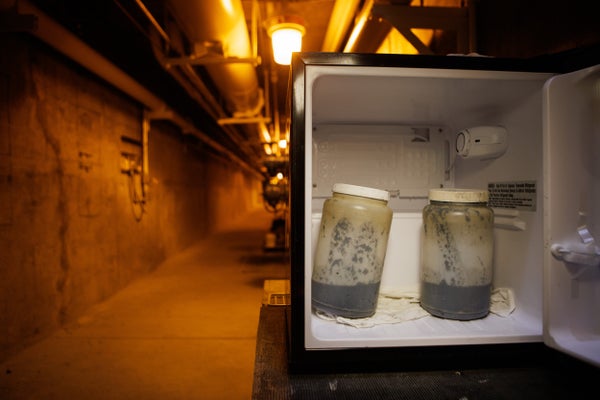
Wastewater samples, such as these collected in San Jose, Calif., can show rising levels of the COVID-causing virus in a community.
Since the start of the COVID pandemic, scientists have tracked the disease-causing coronavirus SARS-CoV-2 by testing water samples from public sewer systems. This practice, called wastewater surveillance, has become an important way to monitor the virus’s spread. Research has shown that coronavirus concentrations in sewage go up and down with community COVID levels. The surveillance has been particularly valuable in the past year because most public health agencies are no longer counting how many people test positive for COVID. Many agencies now use information from wastewater to inform safety guidance, says Amy Kirby, head of the Centers for Disease Control and Prevention’s wastewater surveillance program.
Experts say that if you’re looking to avoid COVID this holiday season, it’s worth wading into the wastewater pool. But on the Internet, wastewater data for a particular community can be hard to find and hard to understand as well. Here’s how to get started.
To begin, find the wastewater testing site closest to where you live. Data from that site will show what’s happening with COVID in your community, says Dustin Hill, an environmental data scientist at Syracuse University, who works on New York State’s wastewater surveillance program. First, check the CDC’s map of testing sites, which includes more than 1,000 sites across all 50 states and Washington, D.C. You may also find nearby wastewater testing sites on the websites of Biobot Analytics, a wastewater testing start-up, and WastewaterSCAN, an academic project, both of which generate data from hundreds of sewer systems.
In addition to these national dashboards, many state and local public health agencies and university research groups share wastewater data on their own websites, says Colleen Naughton, an environmental engineer at the University of California, Merced. Naughton runs the CovidPoops19 dashboard, which shows where wastewater testing is happening around the world. You can use this dashboard to “find if there’s wastewater monitoring near you,” she says. Local websites are often updated more frequently than the CDC’s and designed with specific communities in mind. For example, New York State’s wastewater dashboard is “tailored for the local level,” Hill says.
If your neighborhood sewer system isn’t getting tested for SARS-CoV-2, “nearby communities can be informative,” Kirby says. That means you can look for testing sites in the towns or counties near you or even at testing data for your state as a whole. The CDC recently launched a new dashboard that shares state-level wastewater numbers. This dashboard uses a new metric called the “wastewater viral activity level,” which represents how much recent virus measurements deviate from historical measurements at the same testing site. In the future, the CDC plans to provide similar activity levels for counties and for other diseases, such as influenza and respiratory syncytial virus (RSV), Kirby says.
To understand wastewater trends, ask yourself two questions: First, what are the current levels of SARS-CoV-2 in your community’s sewage? For example, WastewaterSCAN’s dashboard labels testing site results as “high,” “medium” or “low” based on how their current viral levels, compare with measurements accumulated over the past year, says Marlene Wolfe, an environmental microbiologist at Emory University and one of the project’s lead scientists. Second, are the trends during the recent weeks going up or down or staying stable? Such changes should match increasing or decreasing COVID spread in the community, Hill says.
After checking your community’s or state’s wastewater numbers, it’s also important to look at regional and national data because a COVID surge that starts in one part of the country is likely to reach other areas later. The CDC’s new dashboard offers regional and national trends, as do Biobot’s and WastewaterSCAN’s websites. But those trends might look different across the three dashboards. Different data reporting schedules, differences in sewage testing procedures and differences in the communities represented by those national trends all contribute to inconsistencies. WastewaterSCAN is skewed toward California, for example, with more testing sites there than in any other area. That’s because the project is based at Stanford University, which is in that state. But the three national sites generally converge on trend direction.
The dashboards typically don’t, however, tell you what to do when levels are high in your community. “It is such a personal choice, and we have such a range of risk tolerance,” Kirby says. But your options might include masking in public spaces, testing before gatherings and taking extra precautions while traveling, experts say. For health agencies, high disease levels in wastewater may trigger public warnings or influence the agencies to start more vaccine clinics.
While scientists agree on the value of wastewater monitoring, these projects face challenges in the long term. The CDC’s program will require new funding after 2025, and local testing varies widely based on state health departments’ interest and resources. Additional research is needed to better understand how wastewater measurements respond to changes in community health, too.
Despite the challenges, many experts remain optimistic that wastewater surveillance will become a permanent part of the public health system. “There is not only a pressing need to continue to monitor for COVID but also a lot of very compelling evidence that this process is very useful for other diseases as well,” Wolfe says.
[ad_2]